The film Fantastic Voyage demonstrates microscopy through a provocative premise — the miniaturisation of the observer. Appealing as this is, however, it would not yield definitive knowledge of biological processes because the behaviour of, say, a single blood cell does not reflect the properties of blood as a whole. Similarly, the RDTSC machine-instruction, supported by Intel processors from the Pentium onwards, proffers microscopy of time, in that it allows the number of cycles consumed during execution of a section of code to be determined exactly. However, the use of RDTSC is by no means simple, and a number of often-subtle issues must be observed if accurate, consistent and representative results are to be gathered. This article examines these.
|
A version of this article appeared online in association with the June 2006 edition of Dr Dobbs Journal of Programming. |
The RDTSC instruction allows applications to determine the number of machine cycles that have elapsed since the CPU was powered up, and places a 64-bit value in EDX:EAX. Subtracting the value obtained just before execution of a code sequence from that obtained once the sequence has completed yields the number of cycles consumed between the two points.
This figure can then be divided by the clock frequency to yield elapsed real-time if desired, and given this, the example on the right should yield the number of cycles required to construct an instance of a simple class (note this reads just the lower 32 bits of the counter).
However, while this will always give an accurate count of the cycles consumed, results can be inconsistent across repeated executions of the test, and additional steps must be taken to yield representative data.
Firstly, RDTSC is a 'non serialising' instruction, which means that out of order instruction-execution could cause it to return a value before the test sequence has completed. It is therefore necessary to force the CPU to complete all operations before executing RDTSC, and while there are several instructions that can be used to effect this, the most suitable by far is CPUID. This should be executed immediately before the first RDTSC, and immediately before the second.
A second consideration is that interrupts may occur during a test, which will increase the apparent execution time for a test sequence when the CPU is temporarily redirected into an interrupt handler. It is therefore necessary to use the CLI instruction to disable interrupts before executing a test sequence, and to then re-enable them using STI once the test as completed (although you need the appropriate privilege level for this to work).
 class Simple
    {
    private: int Attrib;

    public:  Simple (int Value) : Attrib (Value) { }

    };


 void F ()
    {

    unsigned StartTicks = 0;
    unsigned StopTicks  = 0;

    __asm
       {
       rdtsc;                // Read timestamp counter
       mov StartTicks, eax;  // Copy counter value into variable,
       }                     // uses lower 32 counter-bits

    Simple MySimple (0);

    __asm
       {
       rdtsc;                // Read timestamp counter
       mov StopTicks, eax;   // Copy counter value into second
       }                     // variable

    unsigned Cycles = StopTicks - StartTicks;

    ...

    }
A third issue is that a given machine instruction can be fetched from one of the cache levels or from primary storage. The time that this takes is an overhead that obscures the pure execution time, and must therefore be suppressed as much as possible, which entails fetching the test sequence from the highest cache-level possible. This mandates 'warming' the L1 cache with an initial execution of the test sequence, which requires placing the core test-harness within a loop,
However, while this necessitates storing each test datum as the loop executes, writing the values to an output stream is unfavourable because it requires the execution of more code. This risks overwriting the cached test-sequence, which would force it to be re-fetched from primary storage on the next iteration — this, again, would distort the test data. A similar problem arises, for example, when measuring the temperature of a body of water. The act of placing a thermometer in the water removes heat, thus impinging on the very factor under study. It follows that the least-invasive measurement techniques are best, and in the case of timing code-sequences, placing the results into an array is the most lightweight method possible. Given, also, that non-cache timings should be ignored, the datum obtained from the first iteration of the loop should be discarded when applying the data.
Very numerous iterations should also be avoided, as these will require a large results-array. Test results are cached on writing as much as any other data, therefore large arrays risk overwriting any cached data that the test code may need on a subsequent iteration. This can force the data to be re-fetched from lower in the storage hierarchy, and this overhead will again obscure the pure execution time for the sequence. Given this, and if a large test-data set is required, it is best to repeat an iterated test a number of times, rather than increase the number of iterations in the test loop itself.
Note also that the MOV and CPUID instructions between the RDTSC opcodes in the test harness consume cycles. Given this, the test harness should first be executed without a test sequence between the assembler blocks, and the result then subtracted from any real data that are gathered subsequently.
Given these points, a complete test harness that can be used to time a given code sequence is shown in the listing on the right.
 const unsigned TestMax = 100;

 unsigned       Data[TestMax];

 __asm cli;                        // Disable interrupts

 for (unsigned long TestIdx = 0; TestIdx < TestMax; TestIdx++)
    {
    __asm
       {
       cpuid;                      // Force completion of
                                   // out-of-order processing
       rdtsc;                      // Read timestamp counter
       mov StartTicks, eax;        // Copy counter value into
                                   // variable
       }

     //
     // Code under test goes here
     //

     __asm
       {
       cpuid;                      // Force completion of
                                   // out-of-order processing
       rdtsc;                      // Read timestamp counter
       mov StopTicks, eax;         // Copy counter value into
                                   // second variable
       }

    Data[TestIdx] = StopTicks
                  - StartTicks;    // Place difference into
                                   // results array
    }

 __asm sti;                        // Re-enable interrupts
Using this as a starting point it is possible to create a Timer class, instances of which can be used as 'stopwatch' objects. An alternative is to place the test harness within a function template, which can be parameterised with a functor, or some form of test class. But whichever the approach taken, a temporal clean-room can still elude the unwary: consider the following example, which uses a function template to time calls to A::F and B::F.
Disconcertingly, different statistics can result if the order of the template instantiations is reversed. Presumably, this is because the physical positions of the two functions in the runtime executable-image impinge on the CPU's address calculations. Running one test at a time in a given executable appears, therefore, to yield the most consistent results.
The cycles that elapse during a test may, also, not tally with the sum of the cycles quoted in the documentation for each machine instruction in the test sequence. In part, this is because the manuals reflect only the time to execute an instruction, and do not include the time to fetch and decode it. Moreover, parallel execution can dispatch a sequence of instructions in less than the sum of their cycle-counts — this also confuses matters.
Further to this, and when testing the same code on different machines, it is imperative that you measure the test-harness overhead for each platform (CPUID etc.). Experiments show, for example, the overhead executing in 167 cycles on a PIII, whereas an, ostensibly slower, Pentium MMX romps home in only 33. Woe betide the developer who assumes blithely (as this one did) that the test overhead will be the same or less on a more advanced machine.
It is also tempting to replicate the test code contiguously, and many times, between the first and second RDTSC, and to then average the results. However, this too can generate numbers that are smaller than, and therefore inconsistent with, timing a single instance of the sequence. This is because contiguous replication facilitates instruction prefetching and pipelining, and while this scenario may be unrepresentative of real source-code, it does prove the value of compiler-determined loop unrolling.
 class A { public: void F () { ... } };
 class B { public: void F () { ... } };

 TimerFunc<A> ( ... ); // Template function implements test harness
 TimerFunc<B> ( ... );
While RDTSC operates on a simple premise, it is progress in CPU design that has confounded its use in simple software-chronoscopy. The architectural advances embodied in contemporary CPUs yield stunning performance from a relatively inexpensive package, yet those very advances also conspire to delude the experimenter. A simple illustration of this comes through testing the performance hit that results from adding ever more parameters to a function call, and the first chart plots the cycles consumed by a PIII, when between 0 and 24 parameters are passed (code compiled using Digital Mars V8.40). Note that the Y-axis denotes the statistical incidence of each cycle count because repeated tests do not always return the same figure.

This chart shows a linear increase — which one would expect — from 4 cycles for 0 parameters up to 30 cycles for 24 parameters. While, the latter type of function is rare and desperately inadvisable in real code, it is interesting to contrast this plot with the second chart, which depicts the data generated when the test is performed on a Pentium MMX.
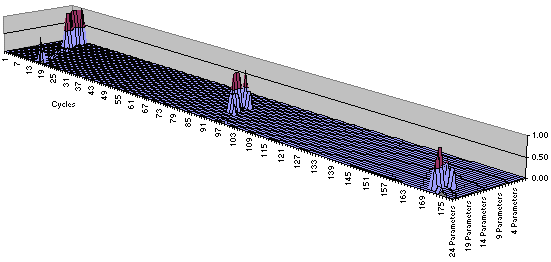
Here the picture is different; not only do calls with many parameters cost considerably more on the older architecture, but there are discreet jumps to around 90 cycles at the 10 parameter mark, and to 170 cycles at 18 parameters. Presumably, again, this is because passing these numbers of parameters impinges in a non-linear fashion on the relevant address-calculations.
Whatever the reason, however, the presence or absence of these artefacts show that to examine performance at the resolution of RDTSC is to be dwarfed by those features of modern CPUs that exploit the economies of scale — akin to studying a blood cell in ignorance of large-scale cardio vascular factors. RDTSC, therefore, is not an alternative to profiling tools, because these exploit other features of contemporary processors, such as the ability to detect cache misses and stalled pipes. However, when used with care, it can be very useful indeed.
Using the RDTSC Instruction for Performance Monitoring
Intel Corporation 1997
This document seems quite hard to track down on the Intel site(s), so try searching for the title on Google, and visit the top link that comes up. Note also that the code in Appendix 3 of the document is incorrect. That is to say, the repeated calls to TestFunc in the listing do not warm the L1 cache with a single copy of the TestFunc code, but place five copies of TestFunc into it. Non-cache fetches are therefore not suppressed, and the call to TestFunc should, in fact, be in a loop.